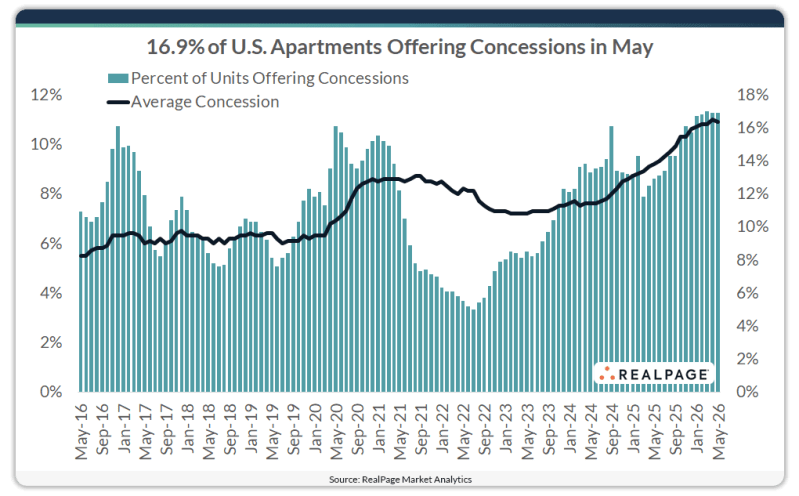
The number of communities offering concessions remained steady at 16.9% in May 2026. While unchanged month-over-month, this concession activity marked a 4-point increase year-over-year and remains near the highest average level of monthly concession activity since mid-2014 (blue bars below).
The average concession (black line below) decreased 0.1 point on a monthly basis to 10.9% in May 2026. While that was a mild dip, it marked the first monthly decline in average concession amounts since March 2024.
Still, May’s 10.9% reading was up 1.7 points year-over-year and translates into nearly six weeks free on a 12-month lease. Overall, U.S. concessions have generally trended upward since reaching a decade low of 5.5% in mid-2016 and remain near their highest level since the post–Great Financial Crisis period (2010).
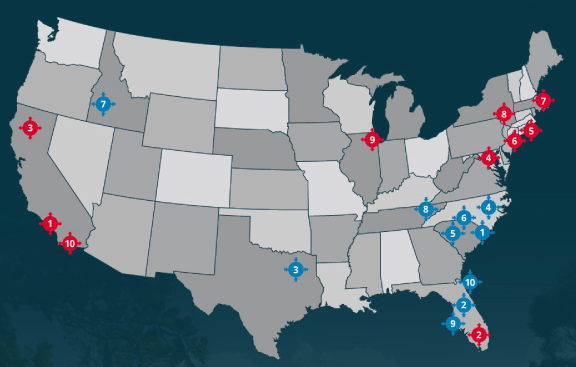
Overall concession use was once again led by the high-supply South at 22.1%, up 0.3 points month-over-month.
Source: RealPage